Simulation and Evaluation
We evaluate BPE using a Python agent-based simulation with 50 sinks, 10 sources, and 3 task types over 1000 timesteps.
Setup
Each sink has heterogeneous true capacity drawn uniformly from and stake from with . Sources emit flow rates from . Capacity signals include Gaussian noise (). The EWMA parameter is unless otherwise noted. We compare three strategies: BPE (capacity-proportional), round-robin (equal split), and random (Dirichlet-weighted).
Allocation efficiency is defined as the fraction of total payment that is productive (i.e., absorbable by the receiving sink): .
E1: Convergence
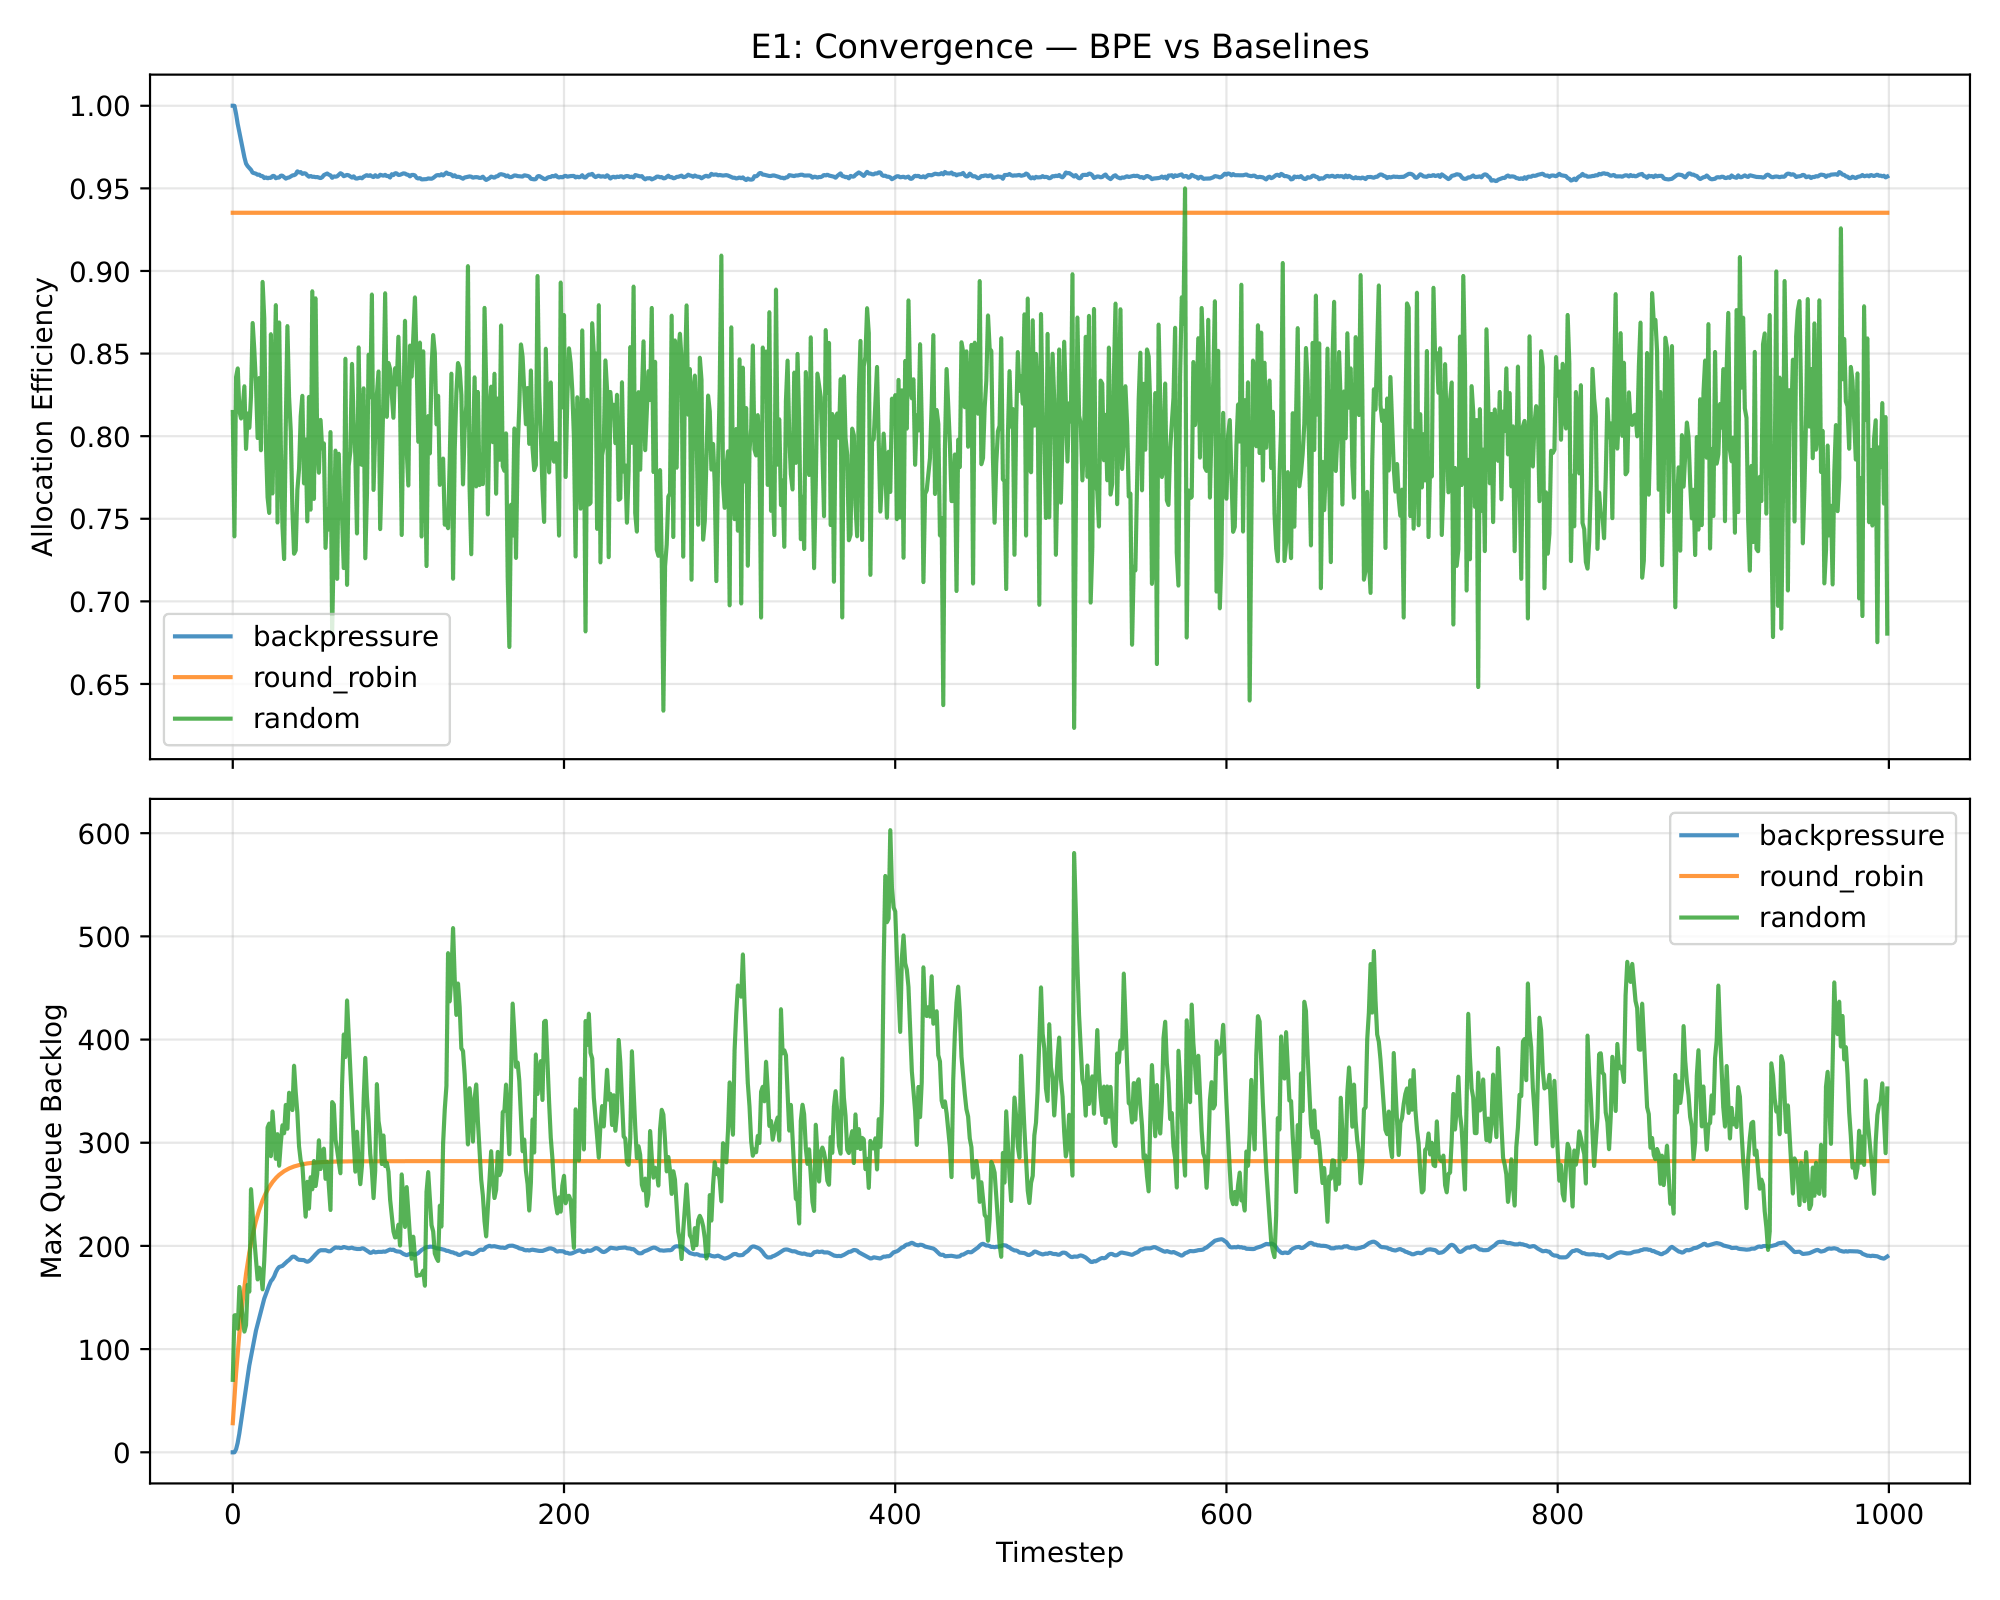
Allocation efficiency and max queue backlog over 1000 timesteps. BPE achieves 95.7% average efficiency (last 100 steps) vs. 93.5% for round-robin and 79.7% for random.
BPE converges to near-optimal allocation within ~50 timesteps as the EWMA smooths noisy capacity signals. Round-robin approximates efficiency only when sink capacities are similar; its fixed-split strategy cannot adapt to heterogeneous capacity. Random allocation shows high variance and consistently suboptimal routing.
E2: Shock Response
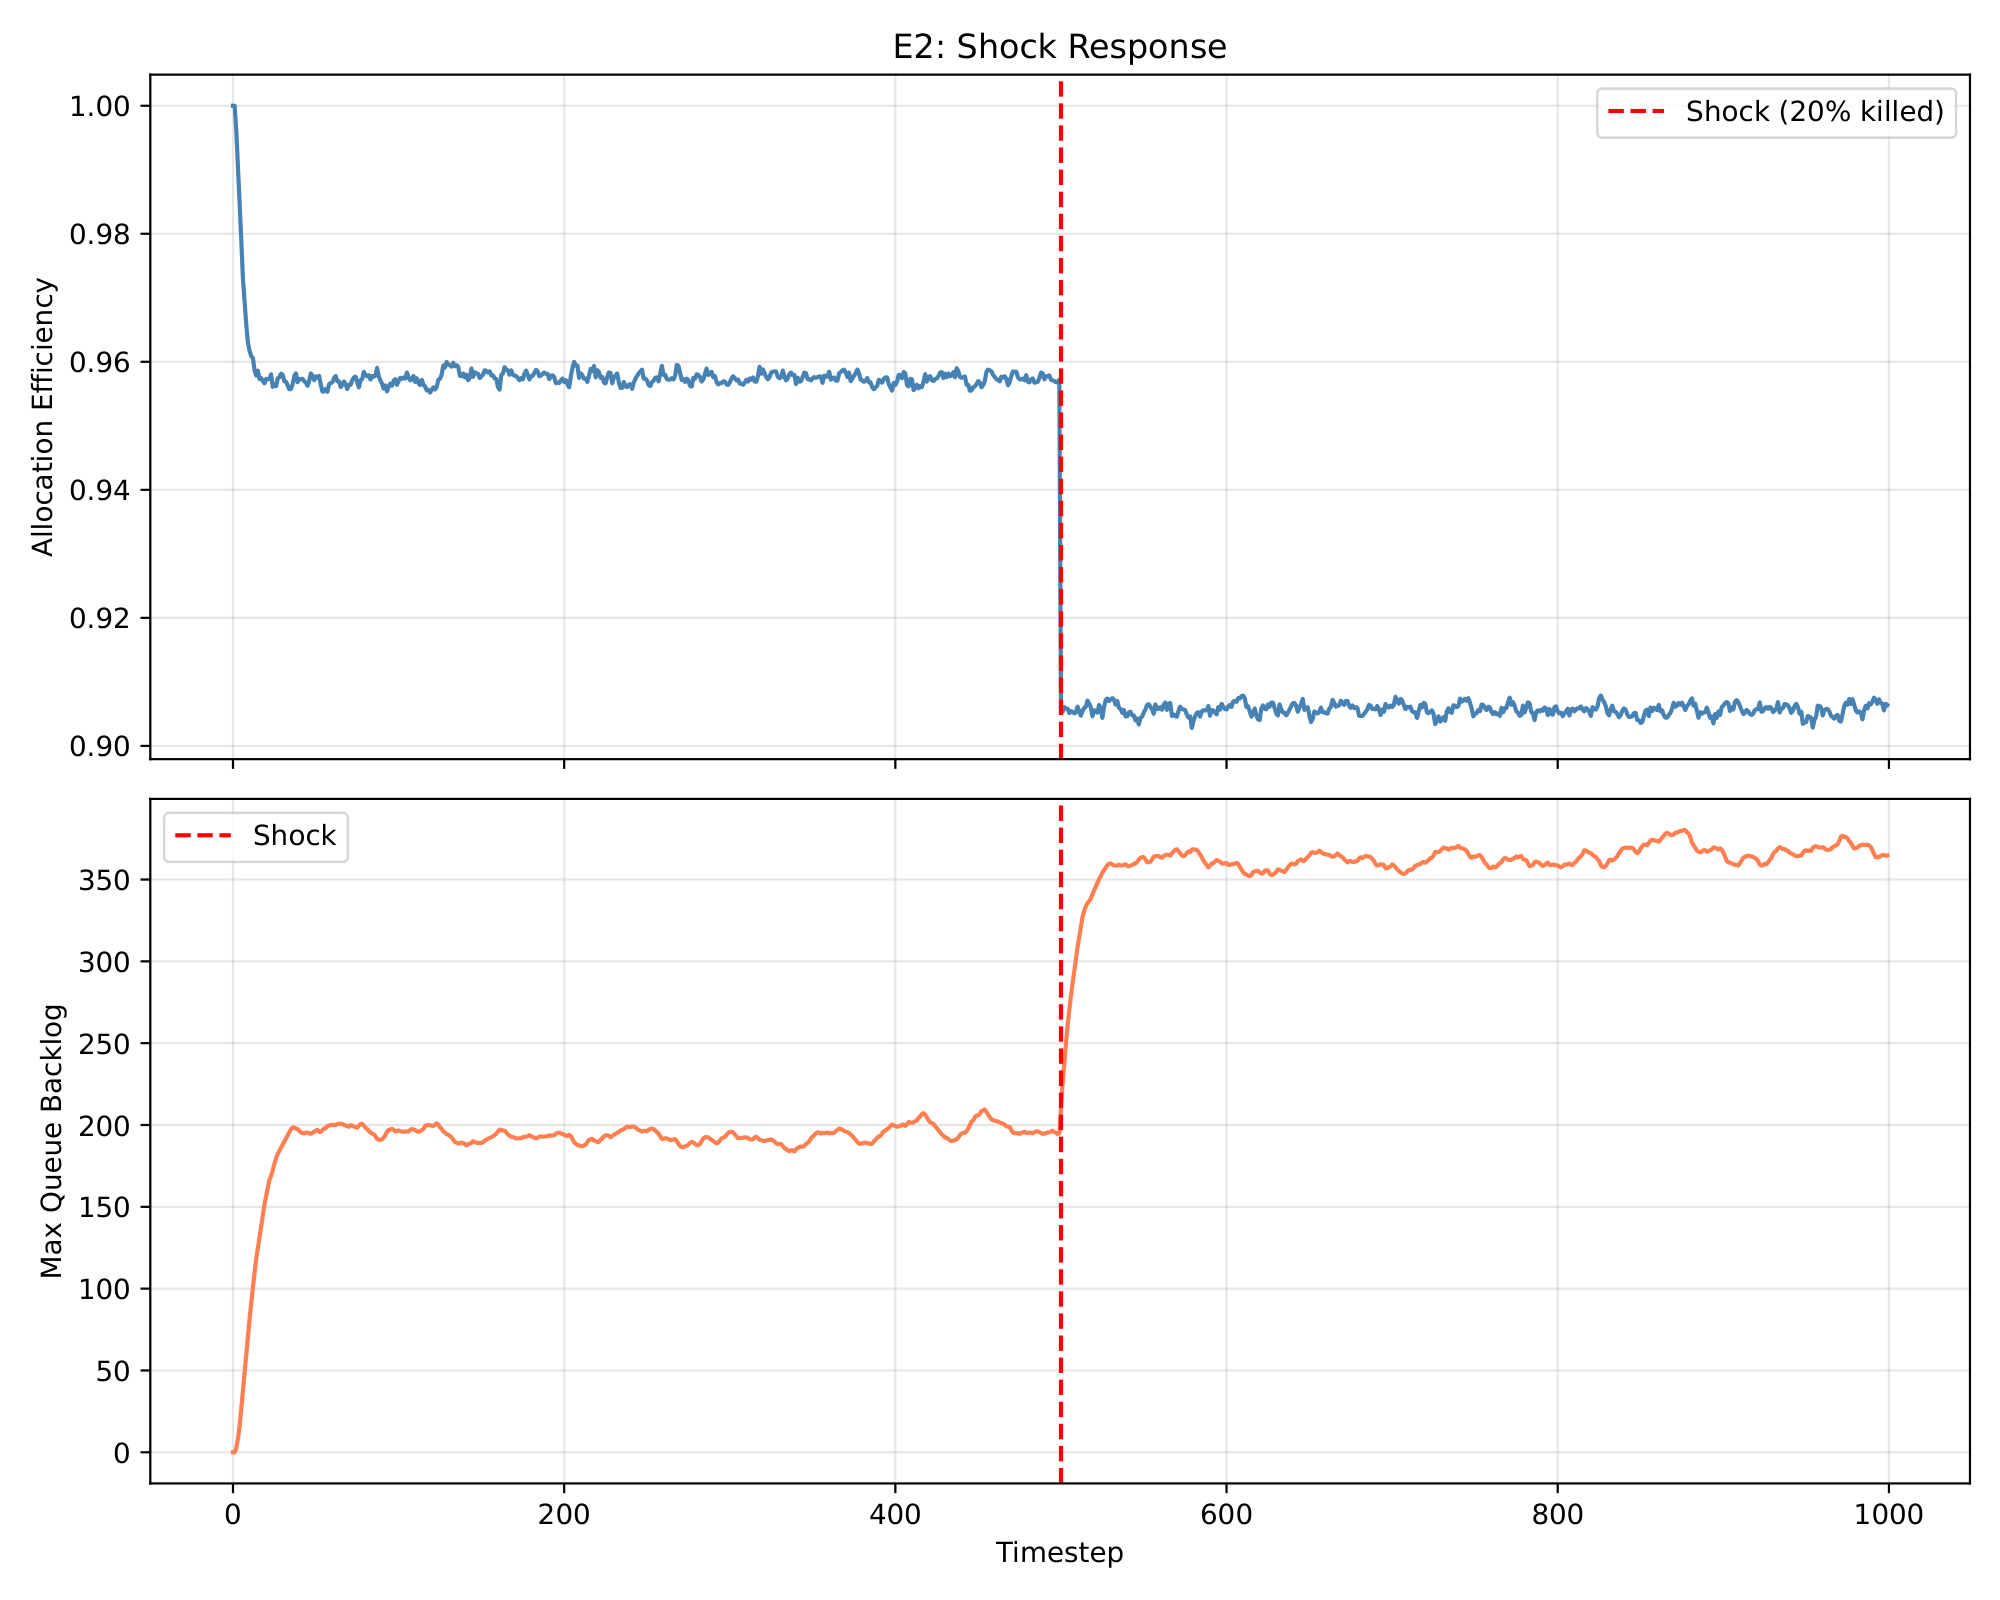
BPE response to 20% sink failure at . Efficiency dips briefly then recovers as EWMA smoothing adapts to the reduced capacity.
At , 20% of sinks are killed (capacity set to zero). BPE's efficiency drops momentarily as the EWMA-smoothed signals lag the true capacity change, then recovers within epochs to a new equilibrium.
E3: Sybil Resistance
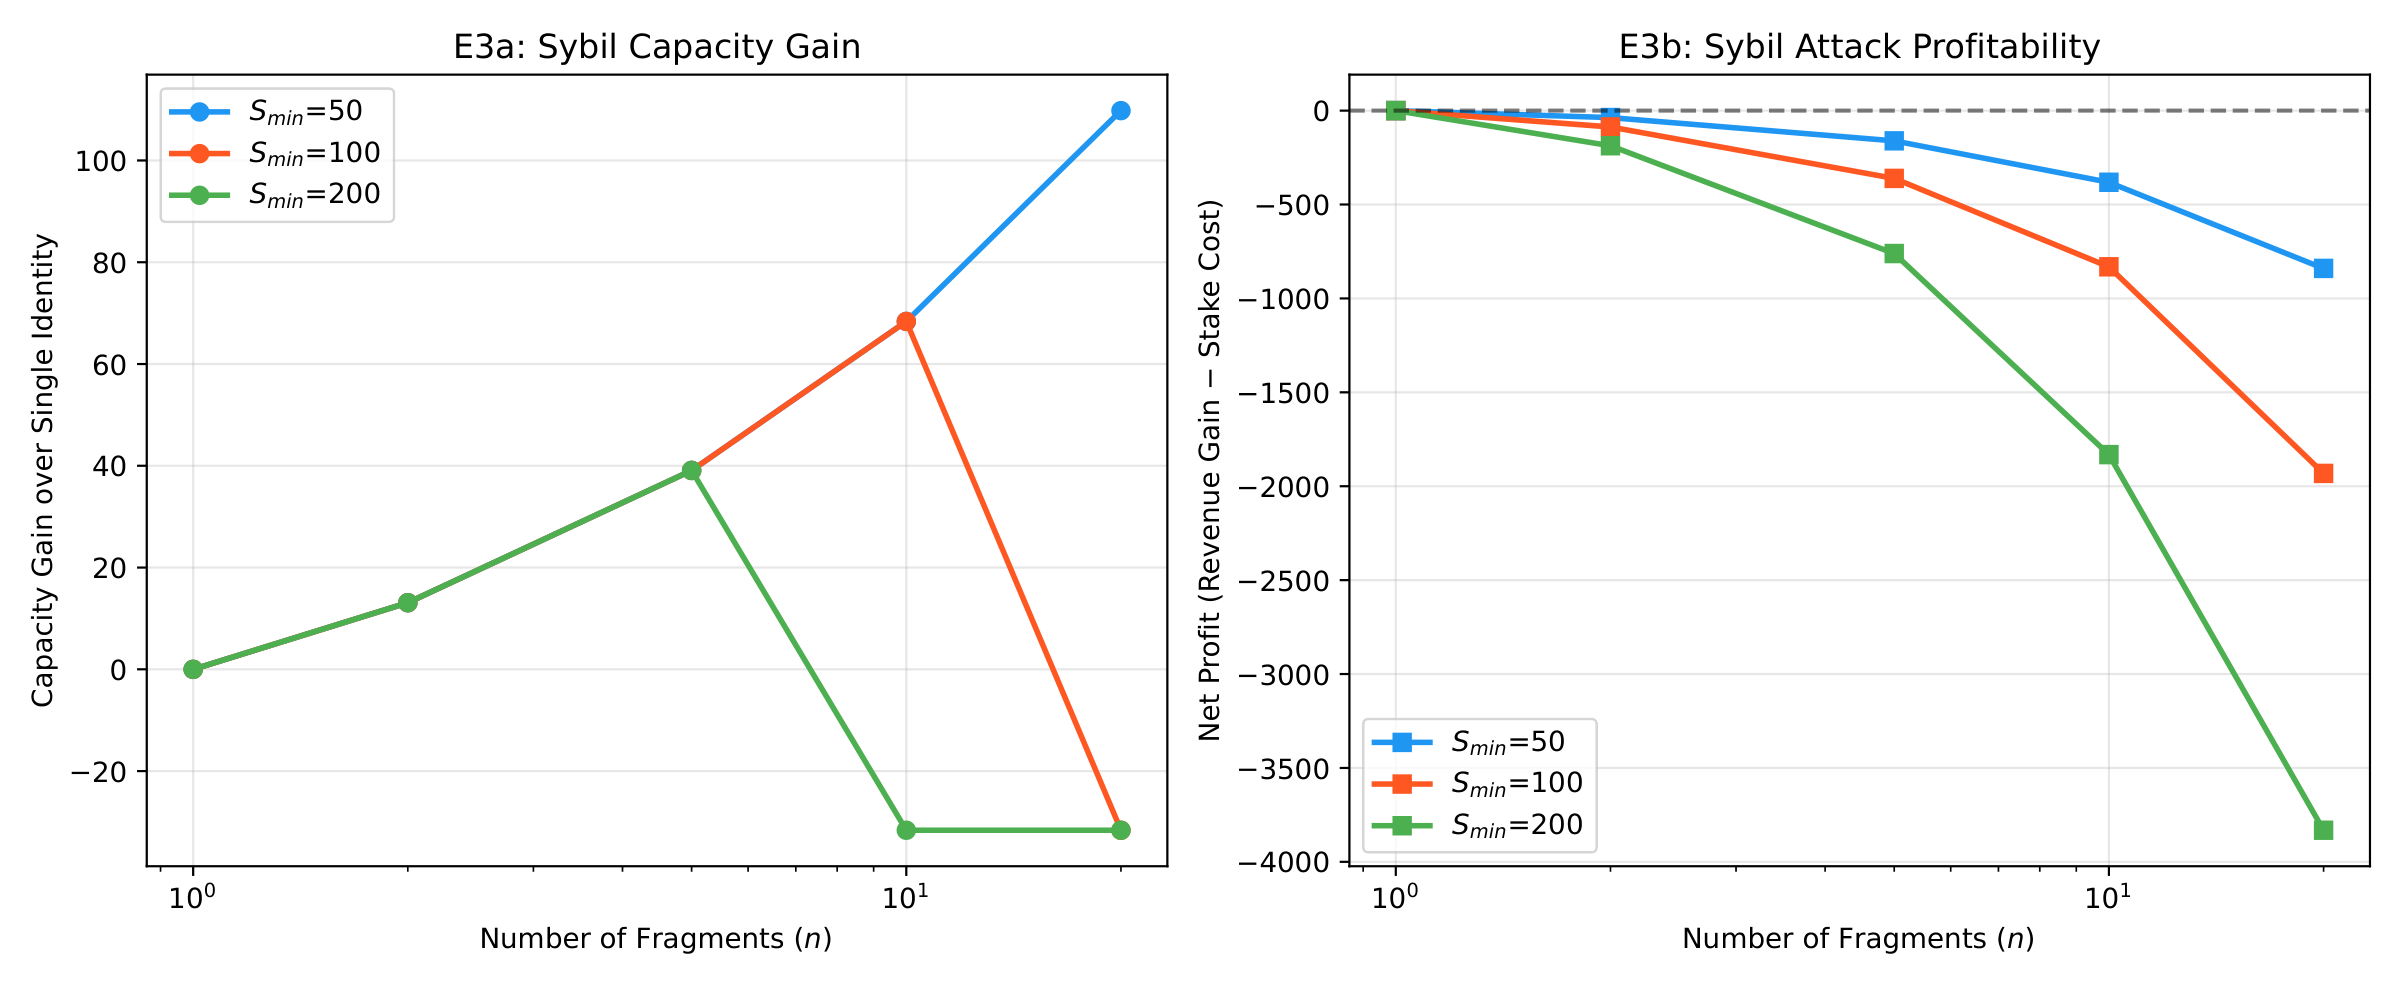
Sybil attack profitability. Net gain decreases as the number of fragments grows, due to cap concavity and per-identity minimum stake cost.
We fix total attacker stake and split into identities. Each identity pays overhead. Total capacity scales as while cost scales linearly. The attack becomes unprofitable at moderate , validating the theoretical analysis in Security Analysis.
E4: EWMA Parameter Sweep
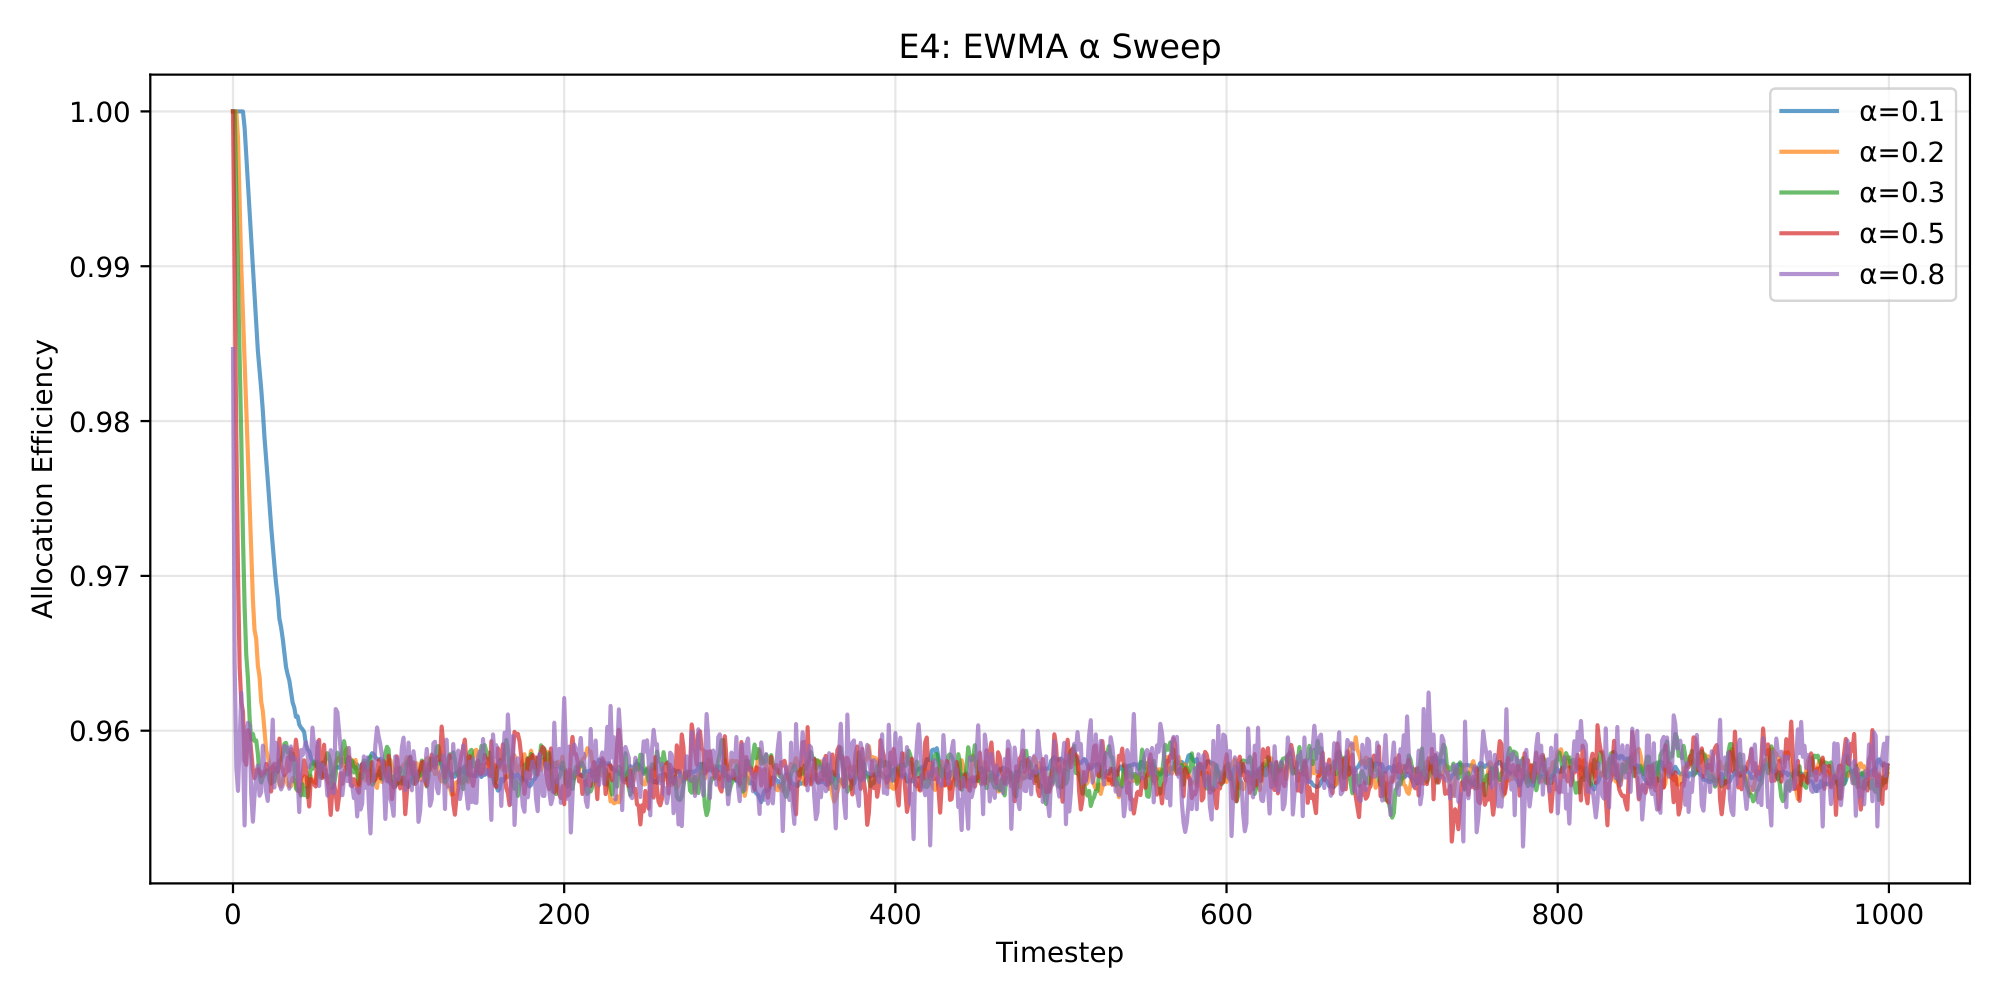
Allocation efficiency for . balances responsiveness and stability.
Low values (0.1, 0.2) yield stable but slowly-adapting signals. High (0.8) tracks capacity changes rapidly but amplifies noise, reducing average efficiency. achieves the best efficiency-stability tradeoff.
E5: Buffer Dynamics
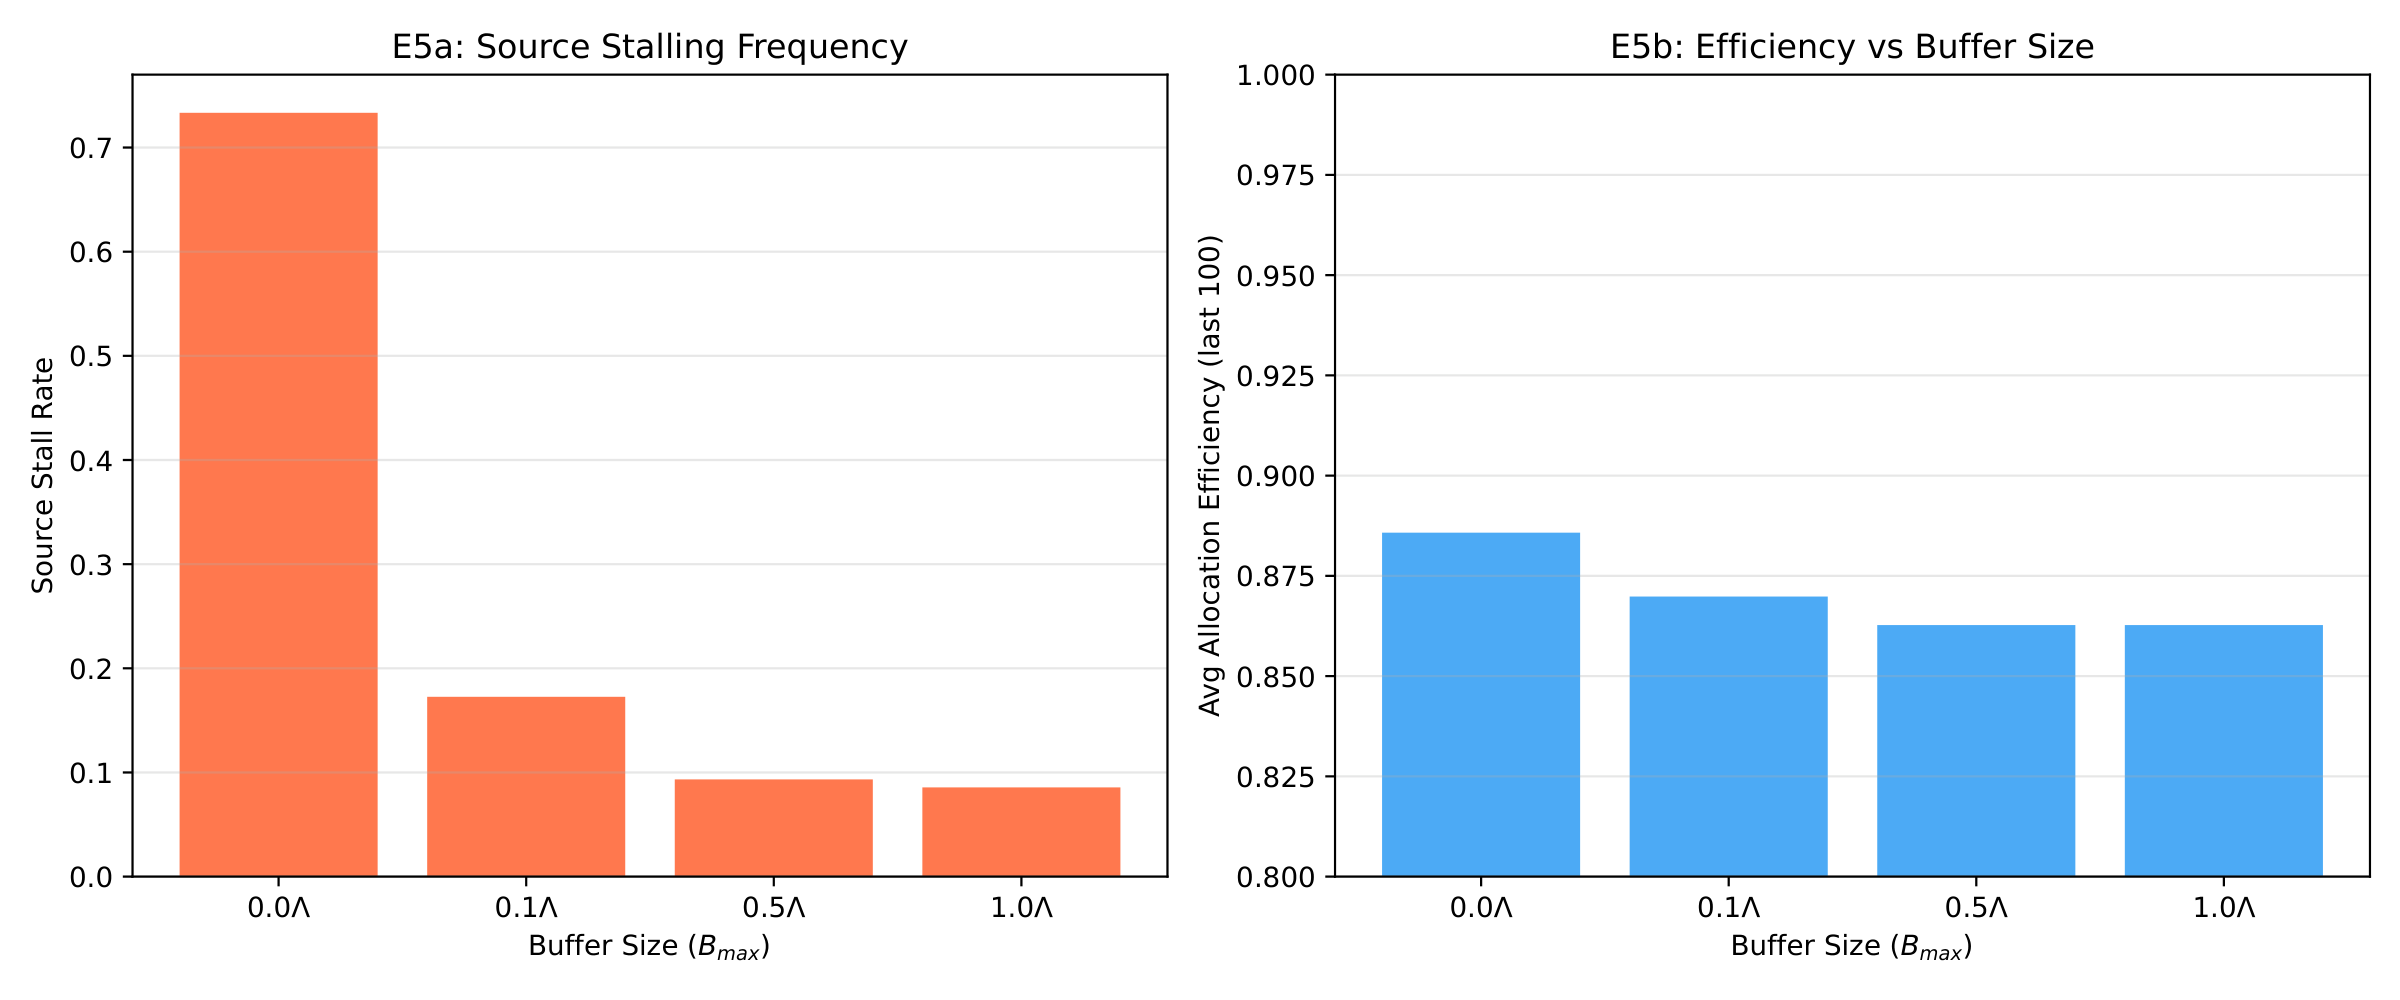
Source stall rate and allocation efficiency under different buffer sizes .
With no buffer (), sources stall frequently whenever instantaneous flow exceeds capacity. Moderate buffers () virtually eliminate stalls while maintaining high efficiency. Large buffers incur capital inefficiency with minimal marginal benefit, confirming the bounded buffer result of Theorem (Overflow Buffer Bound).
E6: On-Chain Gas Benchmarks
We deploy the full contract suite to Base Sepolia and measure gas costs for critical operations. All measurements are single-transaction costs at zero network congestion.
| Operation | Gas | Notes |
|---|---|---|
| Commit capacity | 46,184 | Hash storage |
| Reveal capacity (EWMA update) | 58,287 | Includes cap check + EWMA |
| Off-chain aggregated update | 9,595 | Per-attestation (batched) |
| Rebalance pool (10 sinks) | 187,832 | GDA updateMemberUnits |
| Record completion (dual sig) | 89,421 | EIP-712 verify x2 |
| Report queue load | 28,103 | Per task type per sink |
| Advance pricing epoch | 31,547 | Base fee adjustment |
getSinks (1 sink) | 2,250 | View call |
getSinks (10 sinks) | 22,500 | Linear scaling |
The off-chain aggregation path reduces per-update gas by 83.5% compared to commit-reveal (9,595 vs. 58,287), validating the design choice in Off-Chain Attestation. Completion recording is the most expensive operation due to dual ECDSA recovery, but occurs only once per completed task.
E7: Pricing Mechanism Validation
We validate the dynamic pricing curve by simulating demand shocks against multiple sinks with deployed contract parameters ( BPS, , epoch duration 60s).
Under steady-state conditions with uniform demand across 5 sinks, prices converge to within 2% of the equilibrium base fee predicted by Proposition (Price Equilibrium) within 8 epochs (~8 minutes). When a sudden demand spike doubles the request rate for one task type, the base fee adjusts upward over 6 epochs, reducing demand until the system re-equilibrates. This is the "economic backpressure" effect described in Dynamic Pricing.